
MCPulse is analytics for MCP servers — the piece missing since the protocol shipped.
Publish an MCP server and you currently see nothing. Not how many people installed it. Not which of your tools models reach for. Not whether your descriptions are comprehensible to the thing reading them. Not what your schema costs the people running it. Every other kind of API author gets request logs, error rates and usage per endpoint. MCP gives its author less visibility than a plain REST endpoint, because the protocol never reports back.
MCPulse closes that gap. Two lines inside your own server, and you can see what models are doing with your tools.
WHAT IT MEASURES
Sixteen metrics. Live on ingest: calls per tool, calls per day, which client the call came from, crashes, tool errors, bad arguments, empty answers, latency, result size, sessions, cost per session. From a nightly pass: retries, first-call success, tool pairs. From the startup payload: schema size per tool, and dead tools registered, described, and never once called.
Four of those exist nowhere else.
First-call success asks whether the model asked once, got something usable, and moved on. Retries counts the same tool called twice inside thirty seconds with different arguments — the model rewording and trying again. Same arguments is pagination, not a retry, and getting that wrong grades every well-behaved paginating tool as broken. Empty answers marks a call that succeeded and returned nothing useful: an empty array, a blank string. Those are the failures nobody reports, because the protocol calls them success. Dead tools shows the gap between what you published and what anyone reached for — which call counts actively hide, by only showing you what did get called.
THE FINDING THAT SHAPED THE PRODUCT
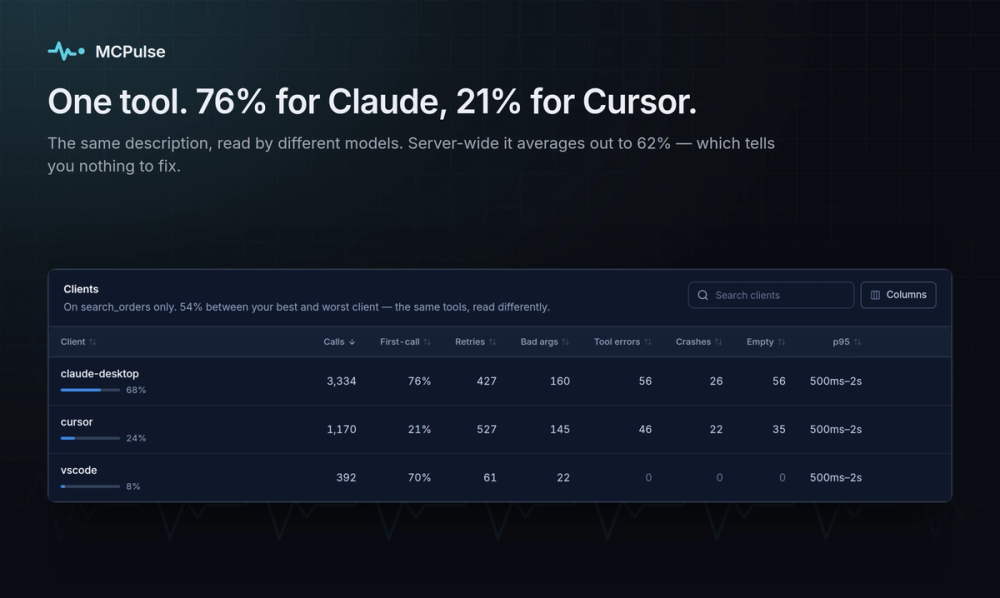
One tool, search_orders. Server-wide it succeeds on the first call 62% of the time. Useless — too high to look urgent, too low to look healthy, nothing in it to act on.
Split by client it becomes two facts: 76% in Claude Desktop, 21% in Cursor. Same handler, same schema, same code. The variable is the model reading it, so the description was ambiguous rather than the implementation broken. No amount of staring at the handler would have shown that.
Every table in MCPulse is therefore keyed by client as well as by tool. Blended metrics average away the thing you need to fix.
USE CASES
Publishing a server for third parties to install, where you have no relationship with the client and no other way to know how it is going. Debugging why a model picks the wrong tool, by seeing which one it reached for instead and how many attempts it took. Cutting context cost, by finding tools that ship schema on every connection and never get called. Comparing behaviour across clients, because Claude Desktop, Cursor and Codex construct tool-selection prompts differently and the same description can be clear to one and ambiguous to another.
THE RESEARCH BEHIND IT
Before writing product code we read the tool schemas of 4,951 public MCP servers — 87,146 tools, 270,487 parameters — to check the problem was real. 17.4% of tools contain no content word distinguishing them from a sibling tool on the same server, rising to 31.3% on servers with more than sixty tools. 21.8% of parameters ship with no description at all. The data and analysis scripts are public so anyone can check the figures.
A free browser-based checker built from that corpus is at getmcpulse.com/check — paste your tools/list JSON and it scores your schema against all 4,951 servers. No signup, nothing leaves your browser.
GETTING STARTED
One import, one wrap after your tools are registered. It returns the same server, so nothing downstream changes. Zero runtime dependencies, an SDK for each of the ten official MCP languages, and the first payload lands within five seconds.
Free forever, with a live demo and no signup at app.getmcpulse.com/m/demo.